Radio-Canada | Info | A-la-une
Grève chez WestJet : que faire si votre vol est annulé?
Au premier jour de la grève, plusieurs clients se retrouvent dans le noir. Voici ce qu’il faut savoir.
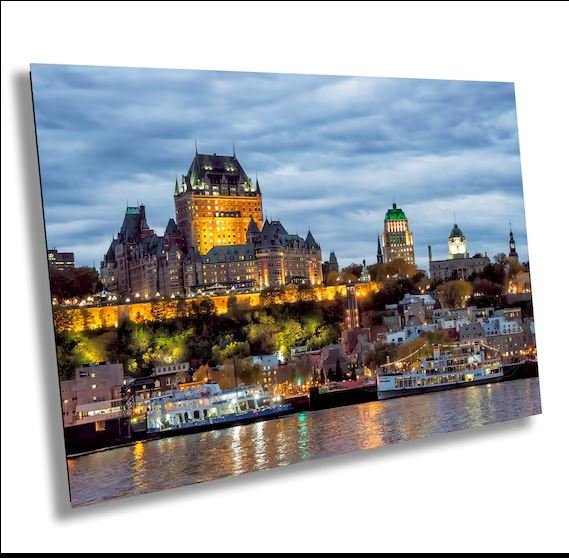
Quebec City, Montreal, Montmorency Falls, Charlevoix, Tadoussac, Old Quebec, Old Montreal, and real life across Quebec in 4K
Real YouTube travel footage with working watch links for every video.
Old Quebec, downtown streets, winter walks, and historic French-Canadian architecture.
Downtown Montreal, Old Port, Mile End, Saint-Laurent, and modern city life.
Montmorency Falls and scenic outdoor views near Quebec City.
Coastal scenery, rural landscapes, ferry routes, and whale-watching destinations.
This Quebec video page is built for visitors who want real places, real streets, and real travel footage. It focuses on the most searched destinations in Quebec, including Quebec City, Montreal, Montmorency Falls, Charlevoix, Tadoussac, Old Quebec, and Old Montreal.
A real walking tour through Old Quebec City showing historic streets, stone buildings, and the atmosphere of one of Canada’s most beautiful old towns.
A full 4K walk through Old Quebec City with historic streets, classic architecture, and strong travel footage.
A downtown Quebec City video showing the heart of the city, urban streets, and real daily movement.
A seasonal walk through Vieux-Québec in early autumn with colorful streets and a calm historic atmosphere.
A winter walk through Old Quebec with first snow, Petit-Champlain, and Château Frontenac scenery.
A spring walking tour of Quebec City filmed in 4K60fps with streets, landmarks, and local atmosphere.
A summer walk through Old Quebec City starting at Place D’Youville and heading through historic streets.
A broad walking tour through Quebec City with old-town scenery and a strong sightseeing feel.
A classic Old Quebec experience with cobblestones, historic buildings, and city-center views.
A second 4K look at the historic center of Quebec City with detailed street-level footage.
A real walking tour through Montreal showing Old Montreal, streets, and the lively city atmosphere in Quebec.
A downtown Montreal video with central city streets, traffic, and urban life.
A summer walk through downtown Montreal filmed in June 2025 with a busy city feel.
A walk along Saint-Laurent Boulevard, one of Montreal’s most recognizable streets.
A winter Montreal walk on Mont-Royal Avenue showing seasonal city life and local shops.
A Mile End walking tour with creative neighborhood streets, cafés, and local Montreal character.
A summer Montreal video showing the Old Port and downtown with strong waterfront scenery.
A downtown Montreal walk including Crescent Street and nearby central areas.
A 4K tour through Montreal’s Mile End district showing a more local side of the city.
A modern Montreal shopping video featuring the new Royalmount mall and retail district.
A scenic video of Montmorency Falls, one of the most famous natural attractions near Quebec City.
A walking tour around Montmorency Falls with dramatic waterfall views and a day-trip feel.
A 4K video exploring Montmorency Falls with close views of the water and surrounding park area.
A clean 4K look at Montmorency Falls and its dramatic height near Quebec City.
A walk around Montmorency Falls showing one of Quebec’s most visited natural landmarks.
A travel-style look at Montmorency Falls with clear scenic views and visitor-friendly footage.
A complete virtual trip through Charlevoix, Quebec, showing scenic landscapes and coastal beauty.
A beautiful drive through Baie-Saint-Paul in Charlevoix with village charm and scenic views.
An autumn walking tour through Baie-Saint-Paul with a charming Charlevoix atmosphere.
A scenic drive through Petite-Rivière-Saint-François showing the rural beauty of Charlevoix.
A travel drive through La Malbaie in Charlevoix with river views and peaceful scenery.
A scenic nature video from Charlevoix showing sunset landscapes and peaceful outdoor views.
A travel adventure in Tadoussac, Quebec with waterfront scenery and a northern coastal feel.
A ferry experience from Tadoussac with river views and the Saguenay Fjord setting.
A memorable day trip in Tadoussac with village life and natural scenery.


